4.1x ROAS and €174k Monthly Revenue for Provenance Foods
- Blended ROAS
- 4.1x
- from 1.6x
- Monthly Revenue
- €174k
- from €57.5k
- Cost Per Acquisition
- €21
- from €36
- Q4 Share of Annual Revenue
- 34%
- from 48%
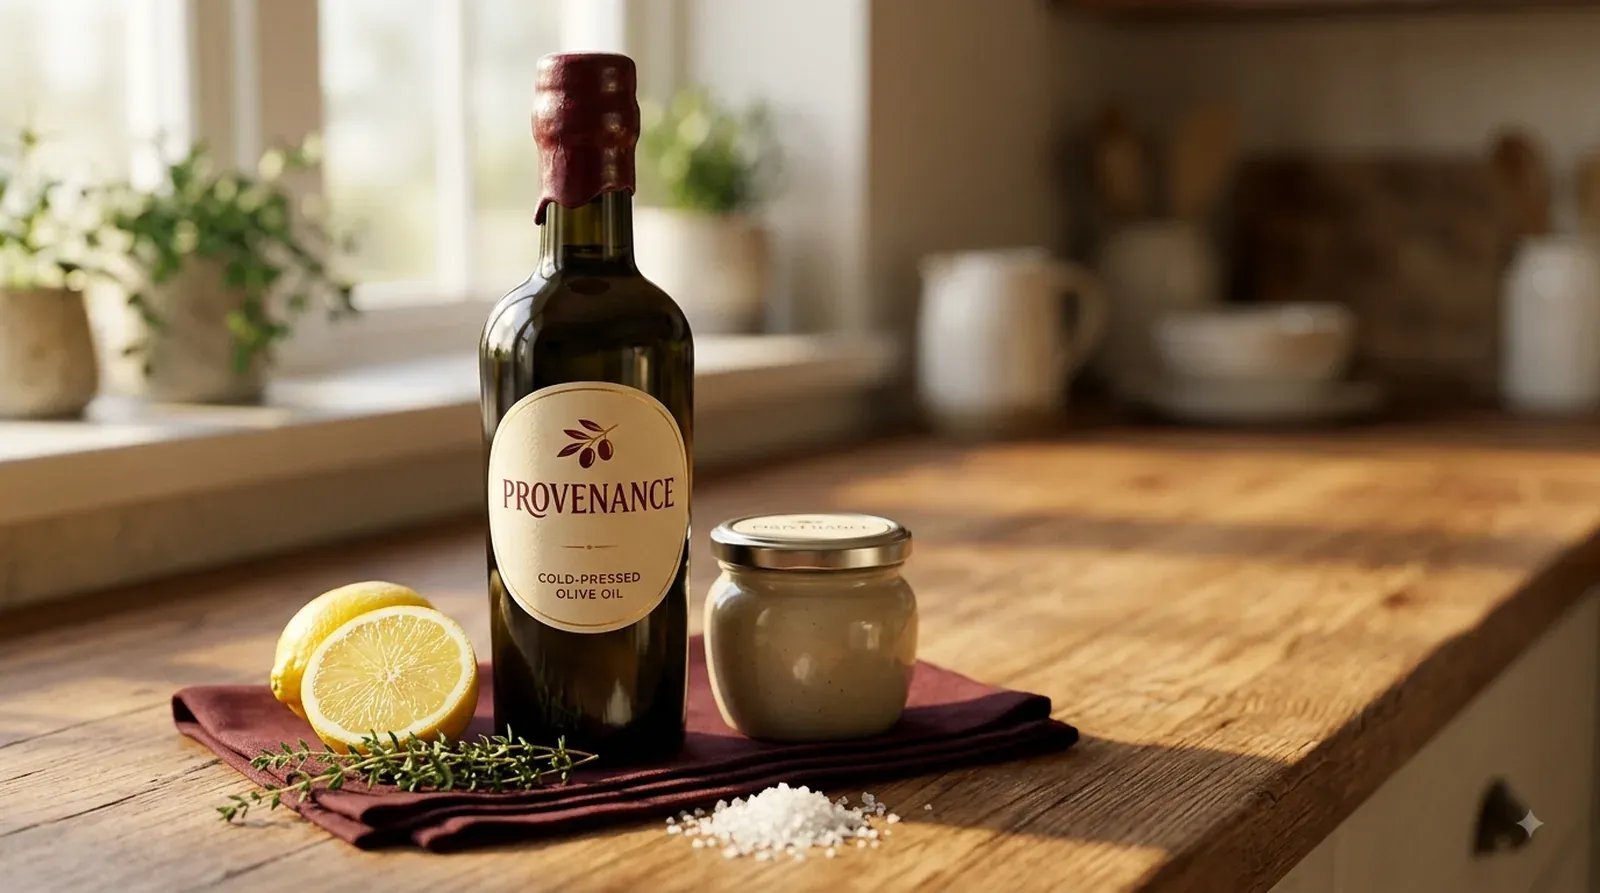
Overview
Provenance Foods is a direct-to-consumer premium food and beverage brand based in Milan, selling specialty pantry staples, artisanal sauces, oils, and curated condiments exclusively through Shopify at a €54 average order value. We started working with Provenance in April 2024, when monthly revenue sat around €57,500 on €51,000 of average monthly ad spend, blended ROAS at 1.6x, and CPA at €36. Today, monthly revenue has grown to €174,000, blended ROAS sits at 4.1x, CPA is down to €21, and Q4’s share of annual revenue has fallen from 48% to 34%.
A seasonality problem, not a conversion problem
This wasn’t primarily a conversion or targeting problem. Going into April 2024, Provenance had built its entire year around a strong Q4 — holiday gifting drove 48% of annual revenue — and struggled with weak, inefficient performance the other nine months, when off-season monthly revenue averaged only €41,000 to €48,000.
We treated this as a seasonality problem first, and everything else second. The goal was never to make Q4 bigger — it was to make the rest of the year genuinely viable on its own.
Four phases, one named turning point
This account’s real strength is a dated, four-phase structure, so that’s the backbone here rather than a channel-by-channel breakdown.
Phase 1: Shopping and Meta rebuilt around hero products
We fully restructured Google Shopping and Meta around hero products and flexible seasonal collections, because so much of the account’s revenue was already concentrated in a handful of SKUs — the media strategy needed to reflect that. New product-page photography and usage suggestions rolled out alongside it, and we began testing two creative angles built for everyday use rather than gifting: “weeknight upgrade” and “hosting made simple.”
Phase 2: First Measurable Lift
Year-round messaging started replacing pure holiday creative, and this is where the seasonality strategy first showed up in the numbers. Off-season monthly revenue rose from the previous €41,000–€48,000 range to €68,000–€79,000, and blended ROAS moved from 1.6x to 2.7x — the first real evidence that a non-gifting angle could actually convert.
Phase 3: Controlled Peak
Holiday campaigns ran with tighter product prioritization. Q4 still performed strongly — this isn’t a story about holiday sales getting worse — but the brand no longer depended on it as heavily as before, since the rest of the year was finally carrying real weight of its own.
Phase 4: Maturation and Compounding
The full year-round creative system and refined audience structure reached maturity. Meta’s table-setting and usage-focused creative consistently delivered 4.3x to 5.1x ROAS — a platform-specific figure, distinct from the account’s blended ROAS — and Google Shopping efficiency improved markedly alongside it.
February 2025 — the first off-season proof point
After the first full off-season run under the new strategy, monthly revenue stabilized above €145,000 and blended ROAS crossed 3.8x for the first time on a sustained basis — not a one-month spike. That February figure is the clearest evidence behind the claim that off-season revenue more than tripled: against the old €41,000–€48,000 baseline, €145,000-plus in what used to be a dead month is roughly 3.2 to 3.5 times the starting point. This is the moment the account shifted from seasonal dependency to genuinely balanced, year-round performance.
What didn't work
A holiday-only account has eleven bad months
This account’s history gives us unusually specific detail on both failures, so we’re using the exact numbers rather than softening them.
Pure holiday-only creative — fully replaced
We ran a pure holiday-only creative set that delivered strong Q4 2024 results, but it collapsed once the season ended — ROAS dropped below 1.4x in January and February 2025. We fully replaced it with year-round messaging.
Broad “foodie/gourmet” interest audience — completely paused
A broad “foodie/gourmet” interest audience never converted efficiently — CPA ran 60% to 75% higher than our lookalike and intent-based audiences — so we paused it completely in June 2024.
- Blended ROAS
- 4.1x
- from 1.6x
- Monthly Revenue
- €174k
- from €57.5k
Blended, peak, and off-season ROAS — not the same number
Three different ROAS figures appear in this account, and they measure different things. Blended ROAS — the number we headline throughout — moved from 1.6x to 4.1x. Peak ROAS, a high-water-mark month rather than a sustained state, reached 5.8x; we mention it once, here, as a ceiling, not the account’s typical performance. The 4.3x-to-5.1x figure from Phase 4 is Meta-specific, describing only that platform’s mature creative, not the whole blended account.
CPA fell from €36 to €21, a 42% reduction. Site-wide conversion rate rose from 1.7% to 2.9%, up 71%. Q4’s share of annual revenue fell from 48% to 34% — the account’s defining structural change, which is why it’s a headline metric here rather than the repeat-purchase-rate pattern used elsewhere in this series.
We don’t think all of this came from the media program alone, and we also don’t think Q4 concentration should go to zero. Gift-oriented specialty food will always carry some real seasonal weight around the holidays — that’s genuine consumer behavior, not a flaw to engineer away. The goal was reducing dependency, not eliminating a pattern every brand in this category experiences to some degree. Broader Italian and EU food and beverage demand trends over this period also aren’t fully attributable to the media program.
From a discovery ad to a repeat order
The path a Provenance customer takes today is built around use, not just gifting.
Two structural shifts, two pairs of donuts
Two distinct stories define this account, so each gets its own pair of charts rather than being folded into one.
What we ran, across the engagement
Four workstreams ran across the engagement, summarized here and detailed in the table below.
| Channel / Workstream | What We Did | Why It Mattered |
|---|---|---|
| Google Shopping & Meta | Full account restructure around hero products and flexible seasonal collections. | Matched the media strategy to where revenue was already concentrated in the catalog. |
| Creative Production | Year-round usage and occasion-based messaging ("weeknight upgrade," "hosting made simple"), replacing holiday-only creative. | Gave the brand something to say the other nine months of the year, not just in Q4. |
| CRO | Product page photography and recipe/usage/pairing suggestions. | Helped a specialty food purchase make sense outside a gifting occasion. |
| Lifecycle Email | Post-purchase recipe and win-back email flows. | Supported the repeat-purchase story alongside the seasonality work. |
Provenance against a typical premium food & beverage DTC account
| Metric | Typical Specialty Food/Gifting DTC Account | Provenance Foods (Actual, EUR) |
|---|---|---|
| Meta ROAS | Specialty and gifting food is the hardest food/beverage sub-category on Meta, typically running around 3.5x ROAS, per AdRiseLab's 2026 food & beverage Meta ads benchmark report. 1 | 4.3x–4.5x on mature Meta campaigns (blended account ROAS: 4.1x, up from 1.6x) |
| Meta CPA | The same specialty/gifting sub-category runs around $34 CPA on Meta, per the same AdRiseLab report. 1 | €21 blended CPA, down from €36 |
Q4’s share of revenue, down from 48% to 34%
Blended ROAS moved from 1.6x to 4.1x. Monthly revenue grew from €57,500 to €174,000, up 203%. CPA fell from €36 to €21. Q4’s share of annual revenue dropped from 48% to 34%. None of this happened in a straight line, and we don’t think it happened from the media program in isolation.
Customer mix
Before
48%
Q4
After
34%
Q4
Q4 moved from 48% to 34% of the total, with Rest of year making up the remainder — a fall of 14 points.
Before
41%
Top 8 products
After
63%
Top 8 products
Top 8 products moved from 41% to 63% of the total, with Rest of catalogue making up the remainder — a gain of 22 points.
Q4's share of our annual revenue has come down from 48% to 34%, which is the number I actually watch now.
Your budget deserves better.
More results
Other engagements.

3.9x
Blended ROAS
from 1.6x
3.9x ROAS and $265k in Monthly Revenue for a Los Angeles Apparel Brand
We took Vespera Apparel from a single undifferentiated Meta campaign and a 14% repeat purchase rate to a segmented account and real retention infrastructure — nearly tripling blended ROAS along the way.

6.4x
Blended ROAS
from 1.8x
6.4x ROAS and $4.8M in Revenue for Luminara Jewelry
We took Luminara from a fatigued, single-tier Meta account and an unoptimized Google feed to a trust-and-consideration funnel built for a $480 purchase — and generated $4.8M in revenue along the way.

3.8x
Blended ROAS
from 1.7x
214% Revenue Growth and 37% Lower Cost Per Purchase for an Austin Skincare Brand
We took Velora Beauty from a hero-product-only account with fatigued creative to a routine-building brand — and nearly doubled repeat purchase rate in the process.