Statistics don’t have to be frightening. You’re not the only person who has heard the terms “t test” and “t value” and wondered what they imply. This guide will guide you through step-by-step in simple ways. You will know what a t test is, what a t value indicates, and why it is important in data analysis at the end.
What is a t Test?
A statistical method for comparing the means (averages) of two groups to determine whether they differ from one another is the t-test. For instance:
- Did two classrooms receive different test scores?
- Was a new medication more effective than an old one?
- After a fresh marketing effort, did sales increase?
A t-test could be the solution to your question, like that.
Why Use a t Test?
If you imagine this:
You give ten students a try at a new study technique, then compare their results with those of ten students who used the previous approach. You want to know if the improvement was genuine or merely coincidental. That can be answered with a t-test.
It determines whether there is a statistically significant (actual) difference between the two group averages or whether it was merely an accident.
What Does a t Value Mean?
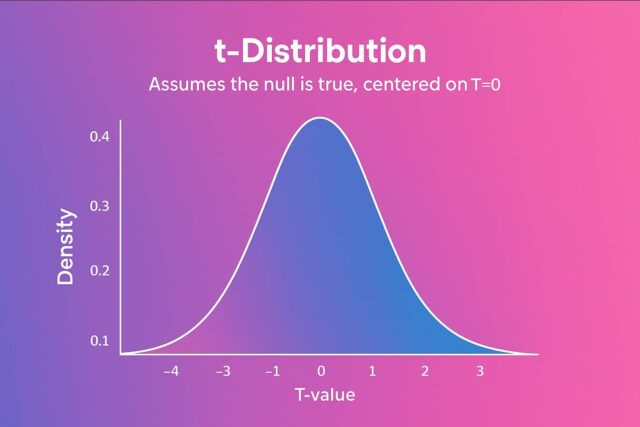
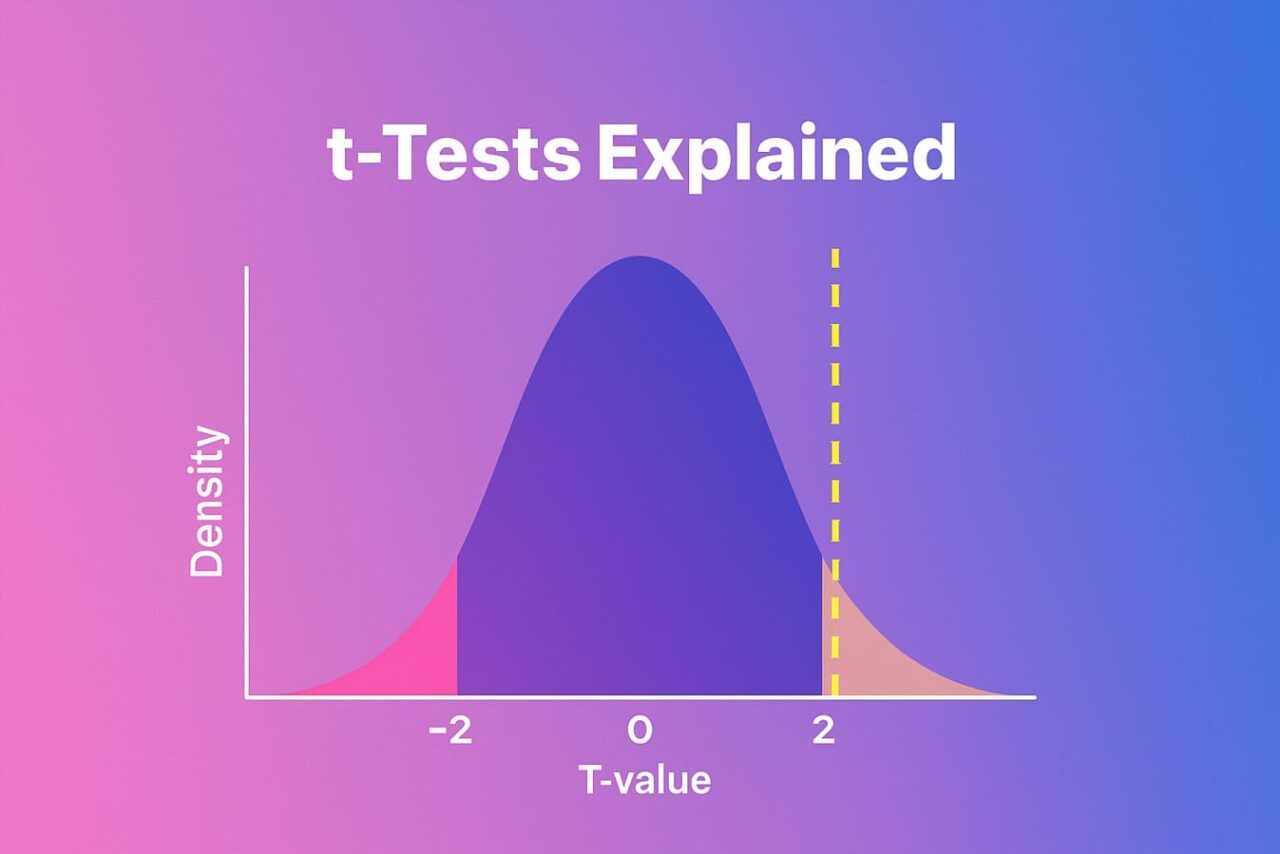
The result of a t-test is a number known as the t value. It indicates the magnitude of the group differences in the amount of variation (spread) in the data.
- A higher t value indicates a greater difference between the groups.
- The groups are more similar when the t value is lower.
The p-value, which indicates the difference occurred by chance, is found with the help of the t value.
Different kinds of t Tests
Three typical kinds are as follows:
- t-test with one sample
used to evaluate a group against a predetermined value.
For instance, does your class’s average score differ from the school’s average?
- An Independent Two-Sample t Test
used for comparing two groups.
For example, two distinct teaching philosophies are used in Group A and Group B.
- The paired t test
When measuring the same group twice (before and after), this method is used.
For instance, test results before and after utilising a new educational software.
The Basics of Calculating a t Value (In Simple Words)
This is how a t value is calculated:
- Determine how the group means differ.
- That should be divided by the standard error, which is a gauge of data dispersion.
The formula appears as follows (don’t worry if it seems complicated):
t = (mean1 – mean2) / standard error
Typically, you don’t make this calculation by hand; internet calculators or programs like Excel, Python, and R can do it for you.
What Is a p-Value?
Finding the p-value comes next after determining your t-value. This indicates the likelihood that the outcomes were the product of chance.
- You can declare a difference to be statistically significant if p is less than 0.05, or less than 5%.
- If p > 0.05, the outcome might not be significant.
Therefore, the t value aids in the computation of the p-value, which, when combined, helps in decision-making.
Is There a Difference?
Assume you instruct ten individuals in a fitness program and take their weights before and after a month.
- Before average: 75 kg
- After average: 72 kg
When you perform a paired t test, your t value is 2.5, and your p-value is 0.03.
You can conclude that the weight loss was probably caused by the program rather than chance because p < 0.05.
Things to Verify Before Applying a t Test

Verify the following to ensure the validity of your t Test results:
- You should use numeric data.
- The two groups should be independent, with the exception of paired tests.
- A normal distribution should be followed by the data, particularly when the samples are tiny.
- When two groups are being compared, their variances (spread) ought to be comparable.
Common Mistakes should be Avoided
- “Not significant” does not imply “no effect.” Your sample size might be too small.
- Don’t only use the p-value. Analyse the magnitude of the influence (the difference’s magnitude).
- Make use of the appropriate test. For before/after comparisons, use the paired t test; for independent groups, use the two-sample t test.
Practical Applications of t Tests
- Medicine: Evaluating different approaches
- Marketing: Determining whether a campaign resulted in higher sales
- Education: Assessing the effectiveness of novel teaching techniques
- Product testing: Comparing ratings for customer satisfaction
Conclusion
A t test is a straightforward but effective statistical technique that can help in data-driven decision-making. The t value, which is central to this approach, indicates whether the outcomes we observe are significant or merely the product of chance.
The finest aspect? To use or comprehend a t test, you don’t have to be an expert in statistics. Anyone can use it in their work, study, or projects if they have a basic understanding of the idea and the appropriate resources. This includes researchers, marketers, and students.
Visit:- Home Page
Please get in touch with us if you want guidance on getting your t Test.


